
Check out our Pulse updates here!
Pulse Webinar Series
Webinar 1. Optimising Chronicle for Pulse (29/05)
This webinar focuses on optimising Chronicle for Pulse. Discover how to create effective Chronicle templates that provide the best data for insightful analysis. We also cover best practices, tips, and tricks to ensure you can leverage the full power of Pulse when setting up Chronicle!
Webinar 2. Pulse Fundamentals & Attendance Tracking (05/06)
In this webinar, we explore the fundamentals of Pulse and how to create powerful Pulse dashboards. Learn how to develop effective Pulse dashboards that assist you in identifying and tracking meaningful trends in attendance data across your school.
Webinar 3. Behaviour Tracking in Pulse (12/06)
This webinar delves into behaviour tracking in Pulse using the data collected in Chronicle entries. Discover how to utilise our Pulse dashboard templates or create dashboards from scratch to effectively track your behaviour data and gain actionable insights!
Webinar 4. Academic Data in Pulse (19/06)
In this webinar, we dive into academic data in Pulse! Drawing from various areas of Compass, such as Analytics, discover how to use Pulse to explore trends in students’ academic progress. Gain valuable insights to enhance student success and optimise educational strategies.
Pulse Overview
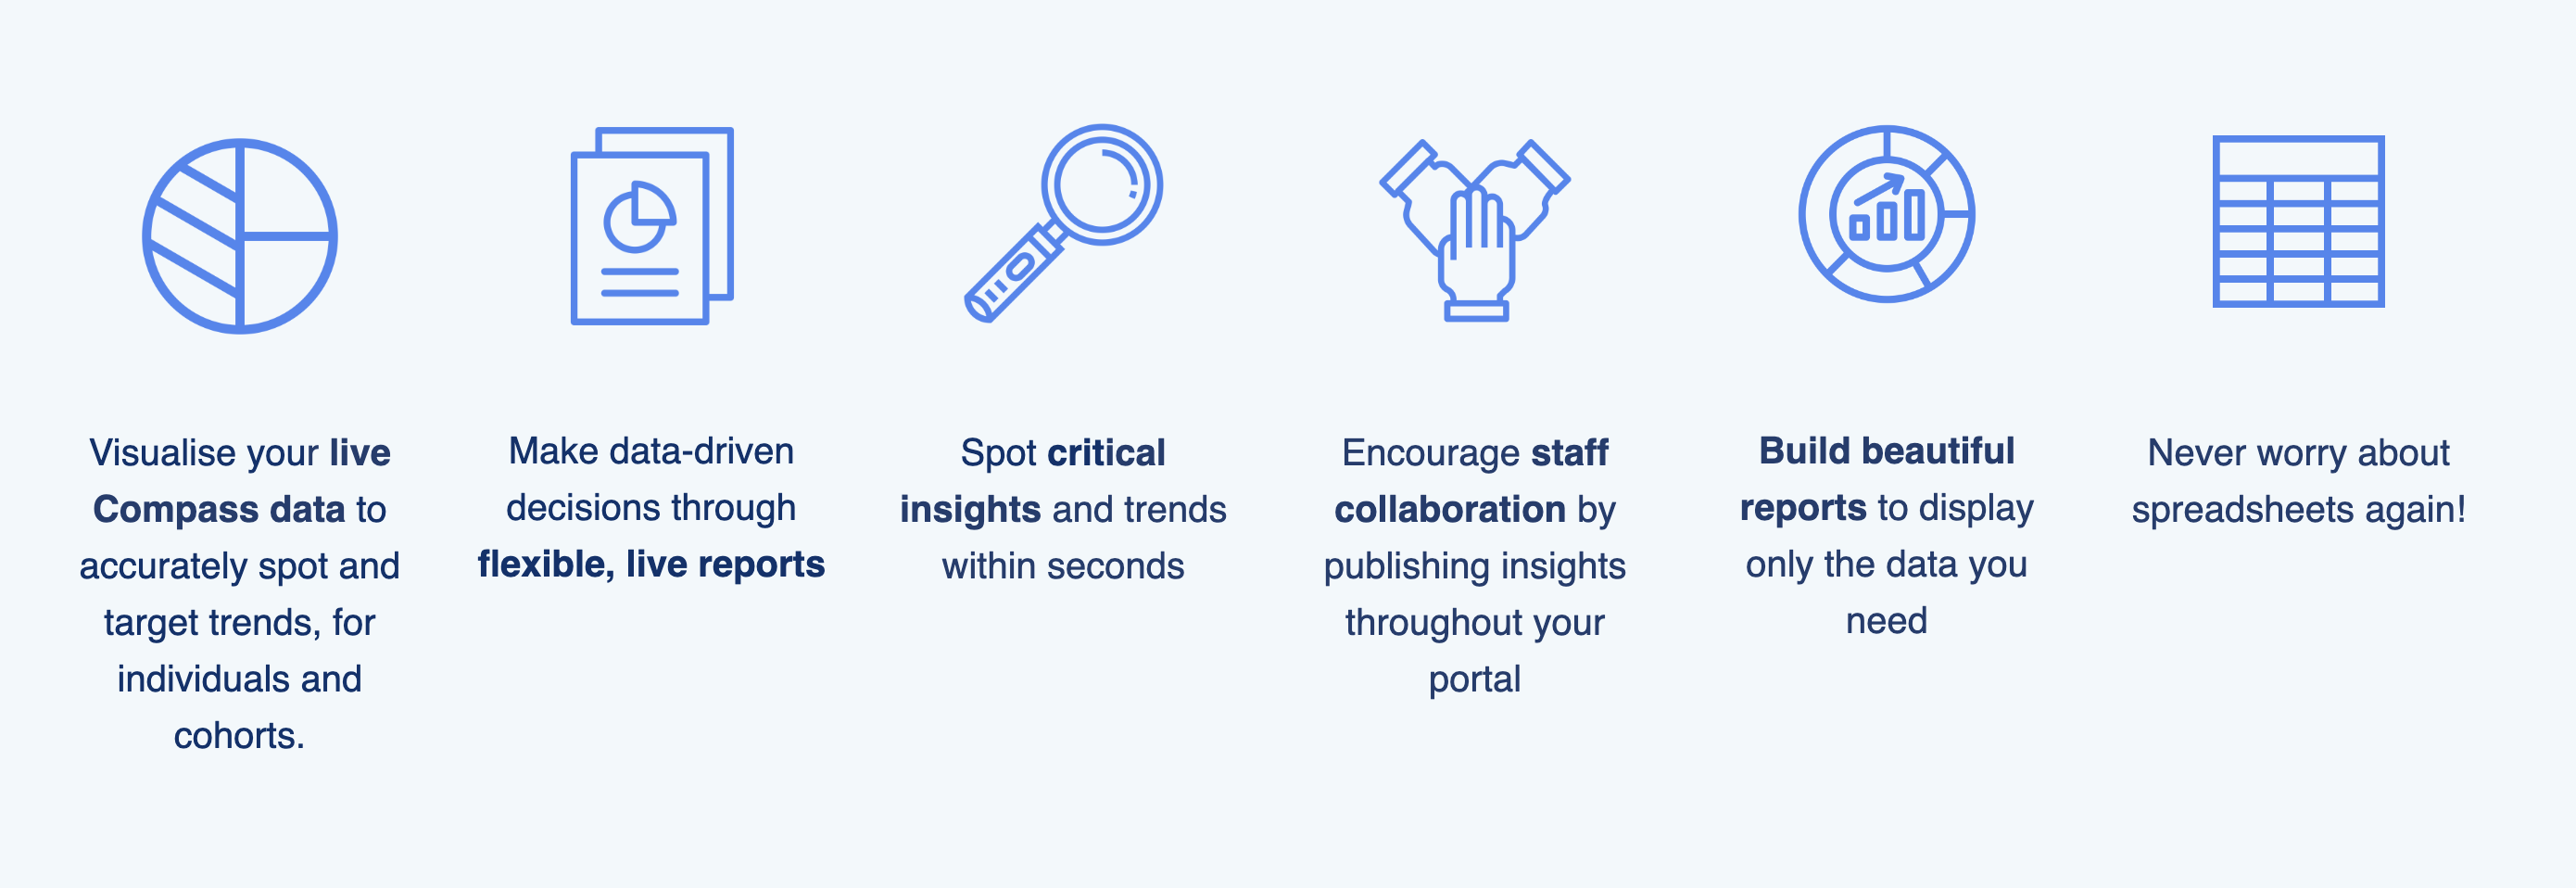
Pulse highlights the information you need in ways that are easy to interpret and share.
You can visualise and distribute your school’s Academic Data (NAPLAN, Learning Tasks, PAT Testing, Victorian Curriculum & Fountas & Pinnell) alongside powerful Chronicle, Attendance and Learning Task insights.
Setting Up Pulse
Step 1
Creating your Dashboards
A dashboard is where you can add and configure the widgets that you’re interested in.
Each dashboard can be published within your Compass portal for staff to view and filter.
Step 2
Adding & Configuring Widgets
A widget is a way of viewing and configuring your data – whether this be a bar, column, pie graph, total or even a watch-list.
Pulse has over 100 widgets for you to choose from, and counting!
Step 3
Publishing & Viewing Dashboards
Once you’ve got the data you’d like to display to your school, you can then publish your dashboard!
This makes sure your dashboards are available for all relevant staff members, in the right places throughout Compass.
Step 4
Pulse Reports
Highly requested by schools, we’ve released the ability to create your own custom reports/spreadsheets through the Pulse Module. Pick your own data sets to fill in the columns of the sheet.
Academic Data
NAPLAN and Victorian Curriculum
PAT Testing
Fountas & Pinnell
Guides & Resources
 Brochure | Academic Data Guide | SWPBS Chronicle Setup |
Pulse Data Map | Custom CSV Guide | Custom CSV Example |